Ulta Beauty's Perplexing Store Growth Re-Acceleration Plans
Prestige beauty's recent downtrend and the company's annual EBIT% next year planned at levels not seen since FY 2011 make a newly announced, aggressive 3-year store growth plan puzzling.
A few weeks ago, Ulta Beauty (ULTA - $383.90) held an investor day.
One of the company’s announced initiatives was to accelerate its store growth (+200 stores over the next 3 years).
Yes, you read that right. Accelerate its store growth.
This is the same company that has recently highlighted (rather, whined about) an “additional 1,000 points of distribution” in the prestige beauty space (largely Kohl’s). Also, Amazon’s Premium Beauty Store has sent shock waves through the industry of late as prestige beauty market share continues to shift online.
So, the company’s newfound store growth plans raise some eyebrows.
Obviously, I’m not a fan of the company’s desire to re-accelerate its store growth. The prospect of more aggressively opening stores again is just odd given the industry’s dynamics of late and a rough couple of years for ULTA specifically. See trailing 4-quarter EBIT% chart below…
But, what caught my eye the most during the investor day was the suggestion of another SG&A Expense de-leverage year in FY 2025.
Historically, ULTA’s kryptonite has been its SG&A Expense.
In the 2-3 years prior to the pandemic, despite large-scale comp store sales growth the company’s SG&A% ratio ballooned. See chart below.
Here’s a closer look at the company’s SG&A Expense ratio juxtaposed next to its comp store sales (FY 2015 through FY 2019)…
FY 2015 SG&A% = +4 Bps vs. LY (comp store sales = +11.8%)
FY 2016 SG&A% = +12 Bps vs. LY (comp store sales = +15.8%)
FY 2017 SG&A% = -24 Bps vs. LY (comp store sales = +11.0%)
FY 2018 SG&A% = +99 Bps vs. LY (comp store sales = +8.1%)
FY 2019 SG&A% = +94 Bps vs. LY (comp store sales = +5.0%)
ULTA’s SG&A Expense woes (inability to leverage) started even before the pandemic and in FY 2024 I’m forecasting the company’s SG&A Expense ratio to rise to an all-time high of -25.3% (or, at least the highest rate since FY 2009’s -25.2% ratio). See model below…
But, here’s what makes ULTA’s SG&A Expense woes even more perplexing… the company has announced $550M of “cost savings” since FY 2019 via optimization efforts (with another $200M to $250M planned for the next three years).
Also, from FY 2017 through FY 2023, the company added approximately $226M of Other Revenue primarily via private label and co-branded credit card programs and Target royalties (i.e., highly leverage-able incremental revenue).
How do I get to $226M of largely credit card program revenue and Target royalties? I start with the company’s FY 2017 10-K which discusses the adoption of ASC 606 and provides a disclosure of $48.9M Other Revenue via shifting the recognition of these amounts from (1) an offset to SG&A Expense to (2) Revenue.
See FY 2017 10-K disclosure below…
Then, I add the annual Other Revenue changes versus the prior year in each subsequent 10-K filing to arrive at $226M in FY 2023 (again, largely credit card program revenue and Target royalties).
My bigger point is that in FY 2023 relative to FY 2019… the company had (1) geometric comp sales growth of +38% over the 4 fiscal years since FY 2019… (2) $550M of cost savings since FY 2019 (per investor day disclosure)… and, (3) an incremental $154M of largely credit card program revenue and Target royalty revenue since FY 2019 (or, FY 2023 estimated Other Revenue of $226M minus FY 2019 estimated Other Revenue of $72M).
Yet, the company’s SG&A Expense ratio de-leveraged by 24 Bps in FY 2023 versus FY 2019 and has moved sharply higher in FY 2024 (likely to eclipse the FY 2009 mark of -25.2%). Now, the company has suggested FY 2025 will be another “investment year” (i.e., continued SG&A Expense de-leverage).
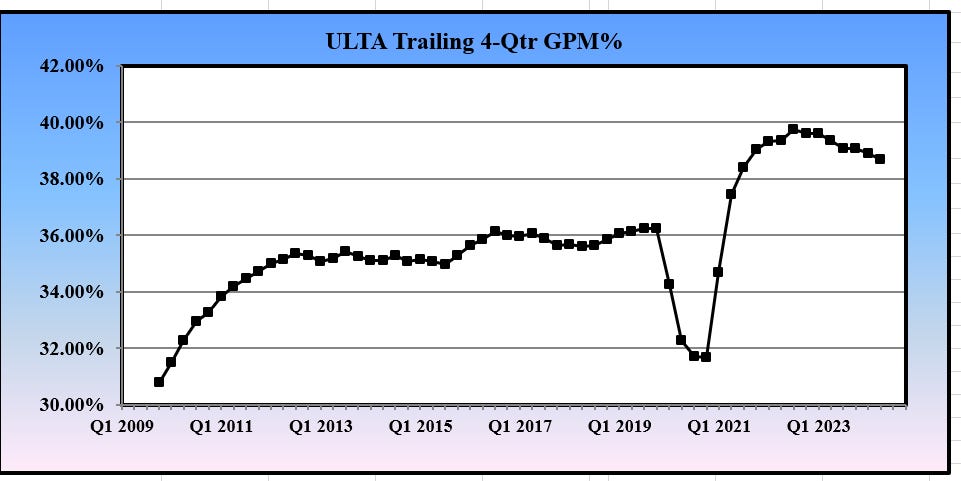
Notice that I’ve yet to mention GPM%. That trailing 4-quarter chart is not moving in a favorable direction either…
All of this is a long-winded way of saying why re-accelerate store growth today?
I believe that guiding to an EBIT% below 12.0% next year (to levels not seen since FY 2011) only suggests that the company’s bottom-line woes today are much deeper than management is willing to admit.
Alternatively, the company could suggest that it is more focused on stemming its bottom-line declines (EBIT%) and forgoing store growth until it fixes its profitability issues. This is a difficult story to ‘sell’ to the investment community and such a decision usually results in large-scale multiple compression.
So, I certainly see why retailers choose to go down this path. Generally, deciding to re-accelerate store growth provides a near-term stock price boost.
But, my view is that, longer-term, ULTA management’s decision to re-accelerate the company’s store growth is only digger a deeper hole for themselves. I suspect that this will become more evident over the next 6-18 months.


